

I’m sure it’s happened to you before… You enter a trade, and everything seems to be going well… but suddenly, the price starts moving like crazy, and you end up exiting with a loss. No, it’s not that you always have bad luck; it’s called volatility. If you don’t control volatility, it’s possible that it will end up controlling you and your trades. And this is where the ATR can help you—one of the most underrated but powerful indicators.
The ATR won’t tell you where the price is headed, but it can tell you how much it might move, and that information can be worth its weight in gold. This is because if you know how much a certain asset can move, you can do the following (among other things):
- Control your stops so you don’t get taken out when you shouldn’t.
- Set realistic take-profits.
- Measure the real risk of each trade.
So, to sum up, the ATR helps you trade with more confidence, even in very volatile markets.
Now that we know the basics, let’s dive into the topic to learn a bit more.
Contenido
History of ATR
This indicator was created by J. Welles Wilder in 1978 in his book, “New Concepts in Technical Trading Systems.” It was designed to solve a major problem we’ve already discussed: to measure true volatility, including those wild price jumps that occur when the market opens with gaps (yes, you can trade with gaps).

Before this indicator existed, traders only looked at the range between the high and low of the day, using that to get an idea of how much the price could change. But it’s clear that this left out key information. Wilder solved this with a new concept: “True Range.” This concept includes:
- Current High – Current Low
- Current High – Previous Close
- Current Low – Previous Close
To construct the ATR, he simply took the average of those true ranges over a specific period (usually 14 candles). The idea seems very simple, but it’s clear that it held great power.
What Exactly Does This Indicator Tell You?
Let’s imagine we’re driving a car. You could say that ATR is our car’s speedometer. Just like in a car, the speedometer won’t tell you if you need to turn left or right, but it will tell you the speed you’re traveling. With that information, you can decide whether or not to take the next curve at that speed.
High ATR
When the ATR is high, it means the price is moving with force. This means the market can move a lot and that the changes in the candles can be very large. We have a more intense, high-adrenalin market, but also a more dangerous one.
This usually happens when:
- Important news about the asset is released.
- The market breaks out of a consolidation phase.
- A new trend begins with considerable strength.
If you know how to manage risk well, this type of market can bring you a lot of joy. Your stop-losses should be wider, and you should avoid trading with too much capital.
Low ATR
If this indicator is low, it means the price is moving very little. The candles will be small, and there’s no clear direction in the market. Here, we’d have the typical boring market, where traders usually don’t do much because it can be a bit frustrating.
When does this occur? It often happens in some of the following cases (among others):
- Consolidation phases before a big move.
- Sideways markets that don’t have major changes.
- Hours of low liquidity (like just before a major market opening).
The most important thing is that a low ATR can be a signal that something is about to happen—like the sea receding before a tsunami arrives. So, stay alert and watch closely, because even though the market seems to be signaling a boring time, something interesting might be on the horizon.
How to Use ATR to Improve Your Trades
Let’s look at some ways to use the ATR.
Smart Stops, Not Guesses
With this indicator, you can set clearer, more logical stops. For example: STOP_LOSS = Closing Price – (ATR * 2)
For example, if you’re trading and your ATR has a value of 1.5, a stop-loss would be placed three points away from the stock’s purchase price.
Avoid False Breakouts
If the price breaks a resistance level but the ATR is low, be suspicious: it could be a trap. But if the ATR is high, it’s a breakout with significant strength, which makes it more logical to enter that resistance breakout.
Detect Major Moves
If a period of calm passes and the ATR starts to rise, it’s likely getting out of its “comfort zone” and an wave you wouldn’t want to miss surfing is about to start building.
Combine ATR with Other Indicators to Boost Your Signals
The ATR shines even brighter when you combine it with other indicators like these:
ATR + Bollinger Bands: Detecting Price Explosions
As we’ve seen, Bollinger Bands show whether the price is within a normal range, but there are more ways to use them with the ATR.
- If the ATR is rising and the price breaks a band, it’s a clear signal that the market is breaking out of a consolidation phase with force.
- If the ATR is falling while the bands are narrowing, it can indicate that a major move is brewing.
ATR + ADX (Average Directional Index): Measuring the True Strength of a Trend
The ADX is also a great indicator to pair with the ATR:
- If the ADX and the ATR are both rising, it’s a clear signal that the trend is strong and explosive.
- If the ADX is high but the ATR is falling, the trend might be losing strength and approaching a reversal.
ATR + RSI (Relative Strength Index): Imminent Reversal + Strength of the Move
With the RSI, you can also see if the market is about to reverse and if it will do so with force:
- If the RSI is below 30 or above 70 and the ATR is rising, it’s a signal that the market is changing direction.
- If the RSI is below 30 or above 70 and the ATR is at a low, it can be a signal that precedes a major change.
The “Volatile Reversal with ATR” Strategy in BlueCandle
I’ve created a strategy using the ATR to demonstrate how it works within BlueCandle.
Required Indicators
We will build the strategy with 3 indicators:
- 14-period ATR
- 14-period RSI
- 5-period SMA
Entry Rules
We will buy when:
- The ATR makes a new low for the last 14 candles.
- The RSI is less than 40.
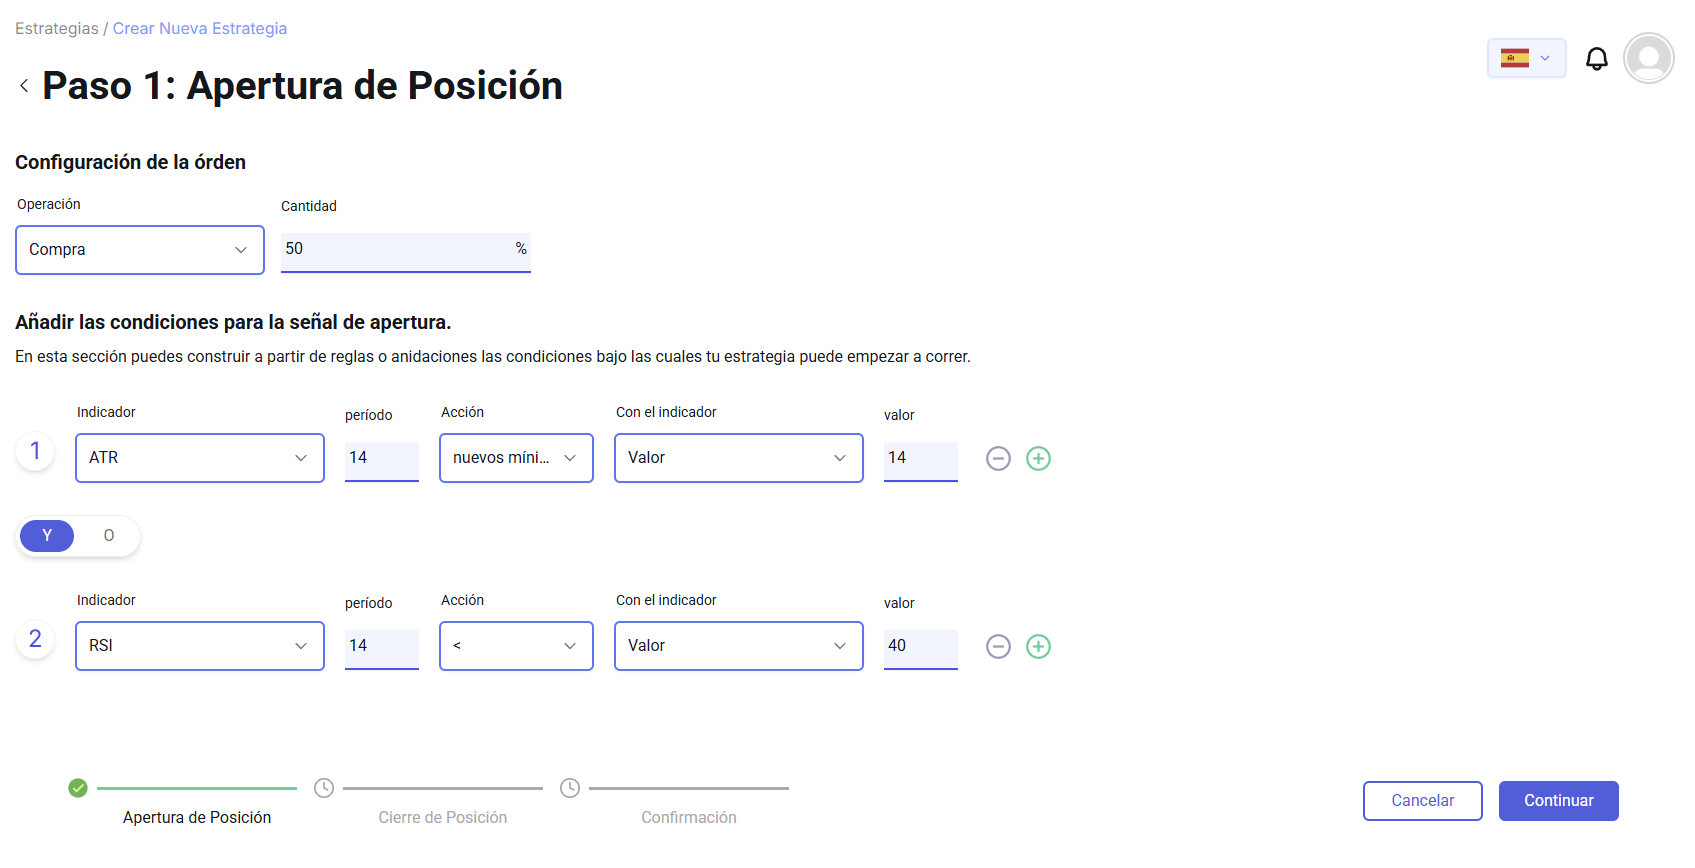
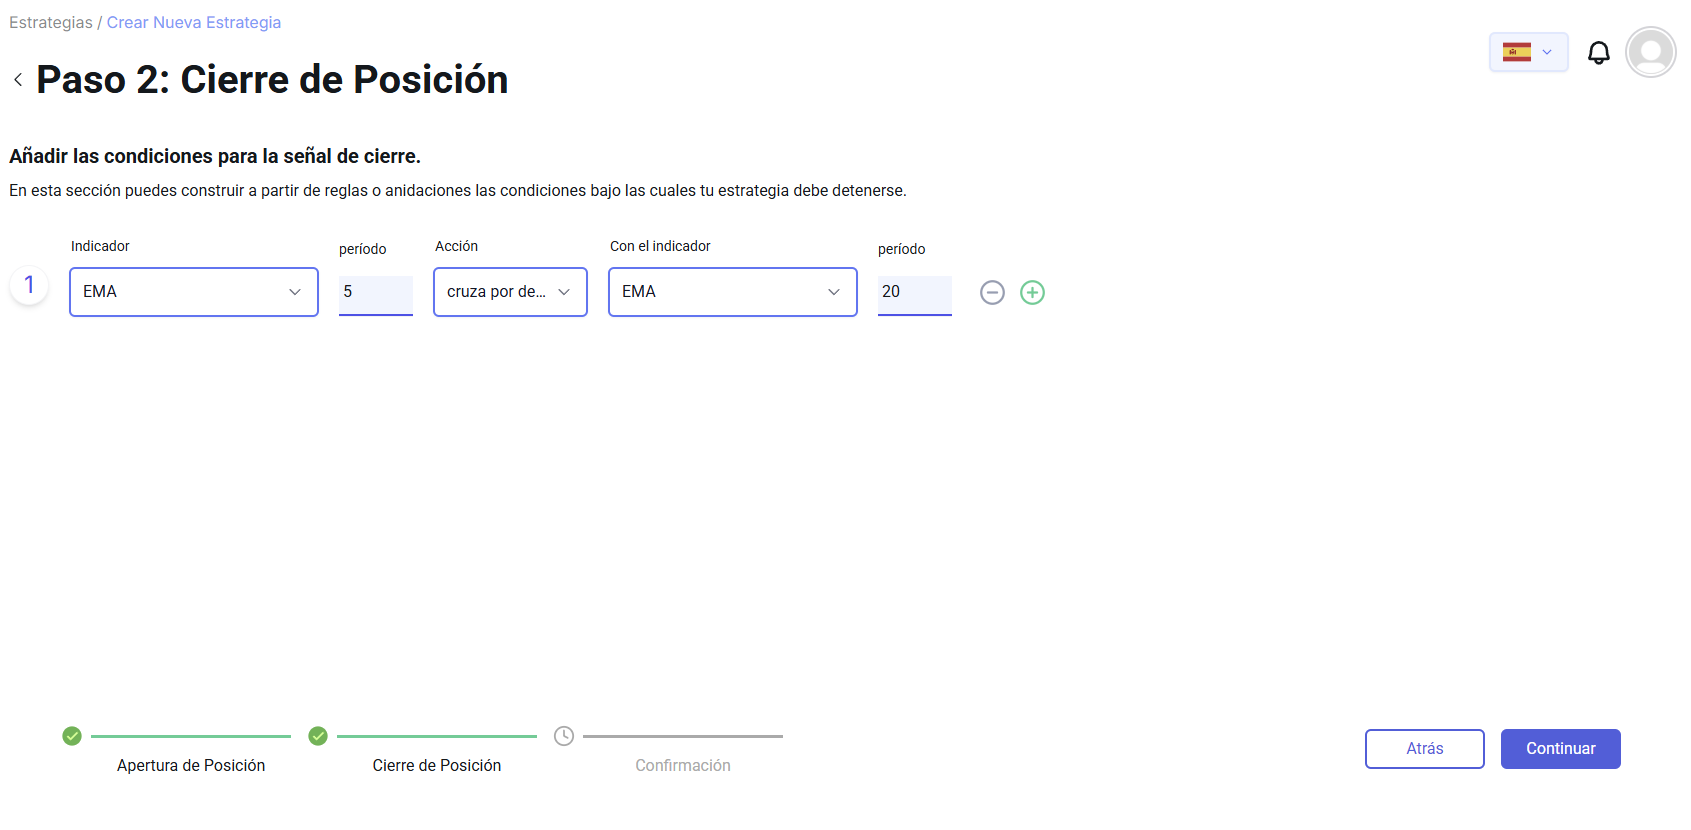
Exit Rules
We will close the position:
- When the closing price is less than the 5-period SMA.
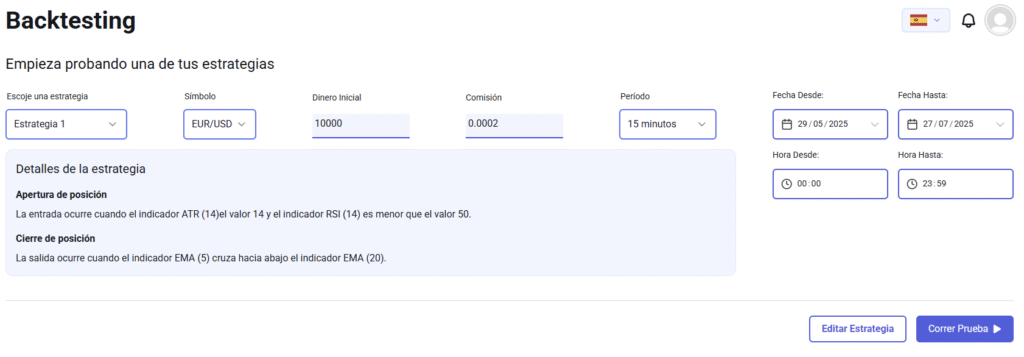
Backtesting
We’ll perform the backtest using the values shown in the image.
Results
Now let’s see what results we have obtained.
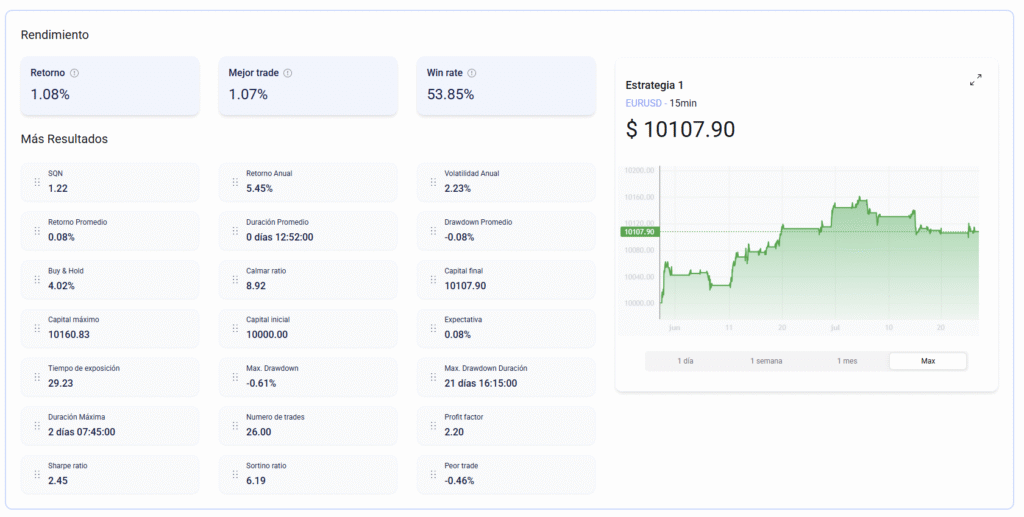
As we can see, the strategy isn’t bad at all. Although it only has a success rate of 53%, when it wins, it wins more than it loses. Our worst trade was a loss of only 0.46%, while the best trade returned 1.07%, which is more than double the loss. The worst drawdown was 0.61%, while the overall return we achieved was 1.08%, which is a good indicator.
So, it seems that when it wins, it does so better than when it loses, and its losses are small. I’m sure this strategy can be improved, so I encourage you to play around with the parameters and include other indicators.
Conclusion
With the ATR, you have the necessary indicator to adapt to changing market conditions. It isn’t a magical or glamorous indicator, but it will give you more clarity when entering your trades.
Do you want to avoid false breakouts and only trade when there’s real market strength? Do you want to identify changes before everyone else? Then put the ATR to work for you!
In BlueCandle, you can visualize the ATR, combine it with other indicators, and run backtests in a matter of seconds. I encourage you to check it out and see all that the ATR has to offer.
No Comments