
If you’ve ever asked yourself: “The market is quiet now, but when will it start moving strongly?”, the Bollinger Bandsindicator is one of the most powerful tools you can use. This indicator measures market volatility and will help us find optimal times to enter or exit a trade.
The most impressive thing about this indicator is its ability to give us a clear and concise interpretation of the overall price context. What it does is actually very simple: it builds a kind of “channel” around a simple moving average (usually 20 periods), using standard deviation to define its limits. For this reason, Bollinger Bands allow you to assess whether an asset’s current price is relatively high or low compared to its recent performance.
If you’re looking for a reliable way to identify areas of high and low volatility, Bollinger Bands are for you! So, let’s dive into them in detail.
Contenido
History of Bollinger Bands
Bollinger Bands were created by John Bollinger in the 1980s, at a time when all traders were desperately seeking easier ways to understand the market. Bollinger developed this indicator as a method to measure market volatility and detect impending price breakouts. He currently has a book exclusively dedicated to these bands, which offers a much clearer and detailed guide on how to apply them.
The logic of the bands is very simple: They expand when volatility increases, signaling moments of greater uncertainty or aggressive price movements. They contract when volatility decreases, indicating a period of consolidation or calm, which usually precedes significant changes.
Thanks to this “breathing” action, traders can dynamically detect overbought and oversold zones, allowing them to create more dynamic price thresholds.
Because they’re so versatile, they are widely used by traders in all markets: stocks, forex, cryptocurrencies, and futures, primarily to detect price breakouts, reversals, and consolidation zones.
Calculating Bollinger Bands
Imagine three lines embracing the price as if they were elastic bands: one in the center, one above, and one below. These are the Bollinger Bands, and how they move directly depends on how “nervous” the market is.
The Bands are calculated as follows:
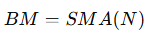
Middle Band (MB):
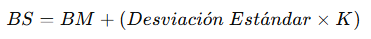
Upper Band (UB):
Banda Inferior (BI):

where:
- SMA(N) → Simple Moving Average over N periods (usually 20).
- K → Standard Deviation factor (usually 2).
- Standard Deviation → Measures price volatility.
Now you might be asking: Okay, but what makes Bollinger Bands special? Truth be told, there are three key details that make Bollinger Bands one of our favorites:
- They dynamically adjust to the market based on volatility.
- They help identify if an asset is overbought or oversold.
- They allow you to anticipate potential breakouts and price explosions.
What’s important to remember is that when the bands are very close together, the market is calm… but beware, this is the calm before the storm. When they suddenly expand, it’s because prices are moving strongly: volatility has kicked in, and probably, an opportunity is in sight!
How to Read Bollinger Bands Without Going Crazy
After understanding the previous point, it’s clear that looking at Bollinger Bands is a bit like looking at a weather map before heading out to sea: it tells you when it’s calm or when something unexpected might be brewing. That’s why it’s crucial to keep the following in mind:
- If the price touches the Upper Band, the asset might be overbought (possible bearish reversal).
- If the price touches the Lower Band, the asset might be oversold (possible bullish rebound).
- If the Bollinger Bands contract, the market is in low volatility and may be preparing for a big move.
- If the Bollinger Bands expand, the market is in high volatility and is more likely to continue the trend.
And how do we translate this into real trading decisions?
- If the price touches the upper band and starts to drop, we might be looking at a sell signal.
- If the price touches the lower band and starts to rise, we could be looking at a buy signal.
- If the bands are very close together, there might be an imminent breakout, so prepare your strategy!!!
You need to keep in mind that you cannot rely solely on Bollinger Bands. Use them like a radar, but confirm your decisions with other indicators like RSI, MACD, or volume. Combination is key!
Signals for Trading with Bollinger Bands
Bollinger Bands not only tell us about market conditions but can also generate several useful signals for trading:
Reversal at Band Extremes (The Most Classic)
- When the price touches the lower band and bounces upwards, it can be a buy opportunity.
- When the price touches the upper band and starts to fall, it can be a good sell signal.
This, combined with another indicator, like the RSI, can be a quite powerful strategy.
Volatility Breakout (Just Before a Big Move)
- If the bands tighten significantly, a big move is expected because, for some reason, the market is about to explode.
- If the price breaks forcefully through one of the bands, it can indicate the start of a new trend.
False Breakouts: Beware!
Sometimes the price breaks a band, but it’s just a movement to scare us. That is, it briefly exits and then re-enters the bands. This can be a false breakout, also known as a “bull trap” or “bear trap” (depending on the direction).
In these cases, you should always wait for confirmation, either with another indicator or with a stronger breakout of the bands that confirms the new trend.
Multiply Their Power: Combine Bollinger Bands with Other Indicators
As we’ve seen so far, Bollinger Bands are powerful on their own, but when you combine them with other indicators, they become even more potent.
Bollinger Bands + RSI
This is the classic duo of technical analysis. The RSI tells you if the price is overbought or oversold, and when you synchronize it with the Bands… BOOM!
- If the RSI is below 30 (<30) and the price crosses the lower band, it’s a signal indicating the price is about to rebound and start rising.
- If the RSI is above 70 (>70) and the price touches the upper band, it’s a good signal indicating the exhaustion of an uptrend.
Bollinger Bands + MACD
With just these two indicators, we combine price, trend, and momentum into a single strategy. Powerful, right?
- A good Buy signal occurs when the price touches the lower band and the MACD crosses above its signal line.
- Conversely, if the price touches the upper band and the MACD crosses below its signal line, it gives us a good signal to enter a short position.
In this case, the confirmation should come from the MACD crossover, not the price crossing the Bollinger Bands.
Bollinger Bands + Volume
Volume often seems to be the forgotten hero in technical analysis, but controlling it can significantly improve your strategy.
A good market strategy can be when the Bollinger Bands have narrowed significantly, and suddenly the price breaks one of the bands accompanied by very high volume.
This usually means we are at the beginning of a major trend, so we can take advantage of it.
Simple Strategy with Bollinger Bands in BlueCandle
Let’s see how we can quickly implement the Bollinger + RSI strategy and check its results.
Required Indicators:
- Bollinger Bands (20 periods)
- RSI (14 periods)
Entry Rules:
We will place a buy order when:
- The price touches the lower band.
- The RSI is oversold (<30).
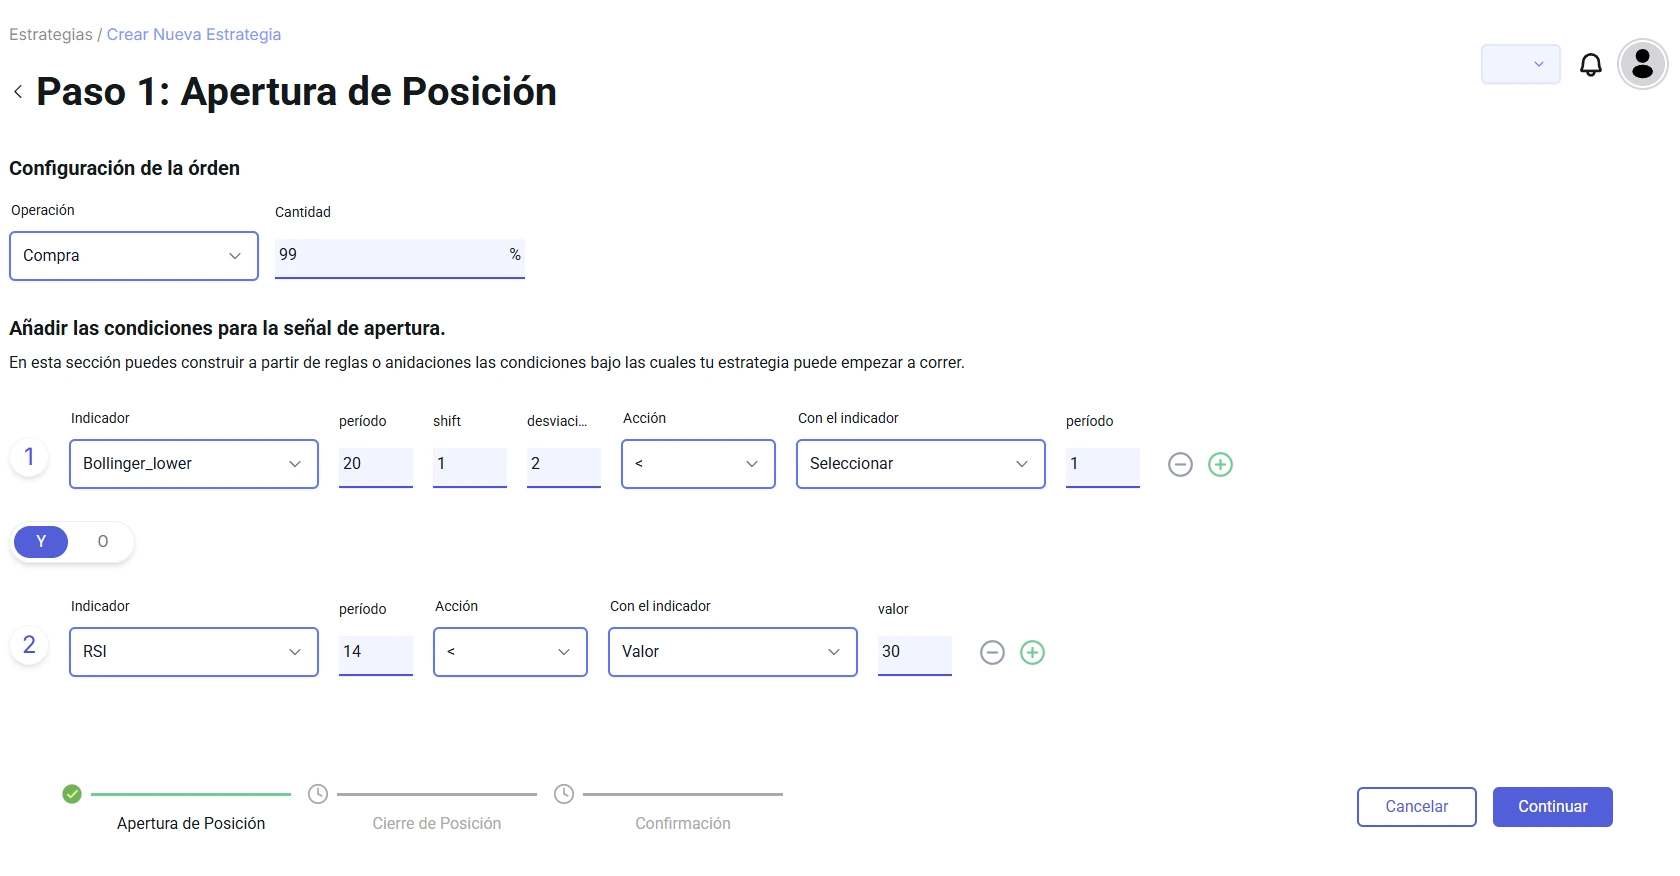
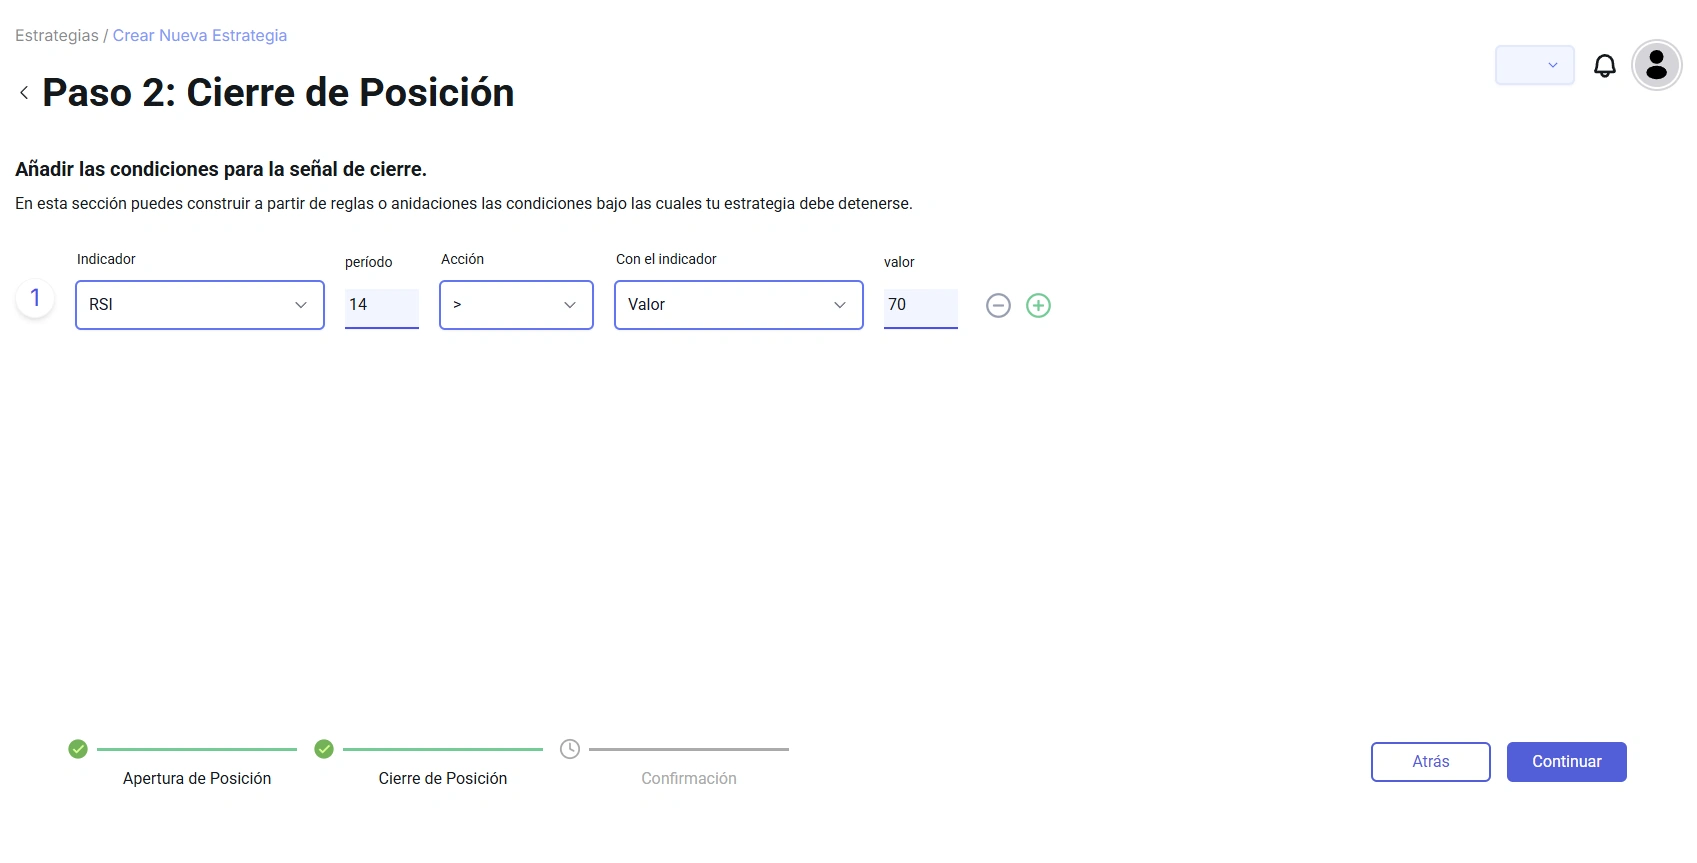
Exit Rules:
- When the RSI is 70 or higher.
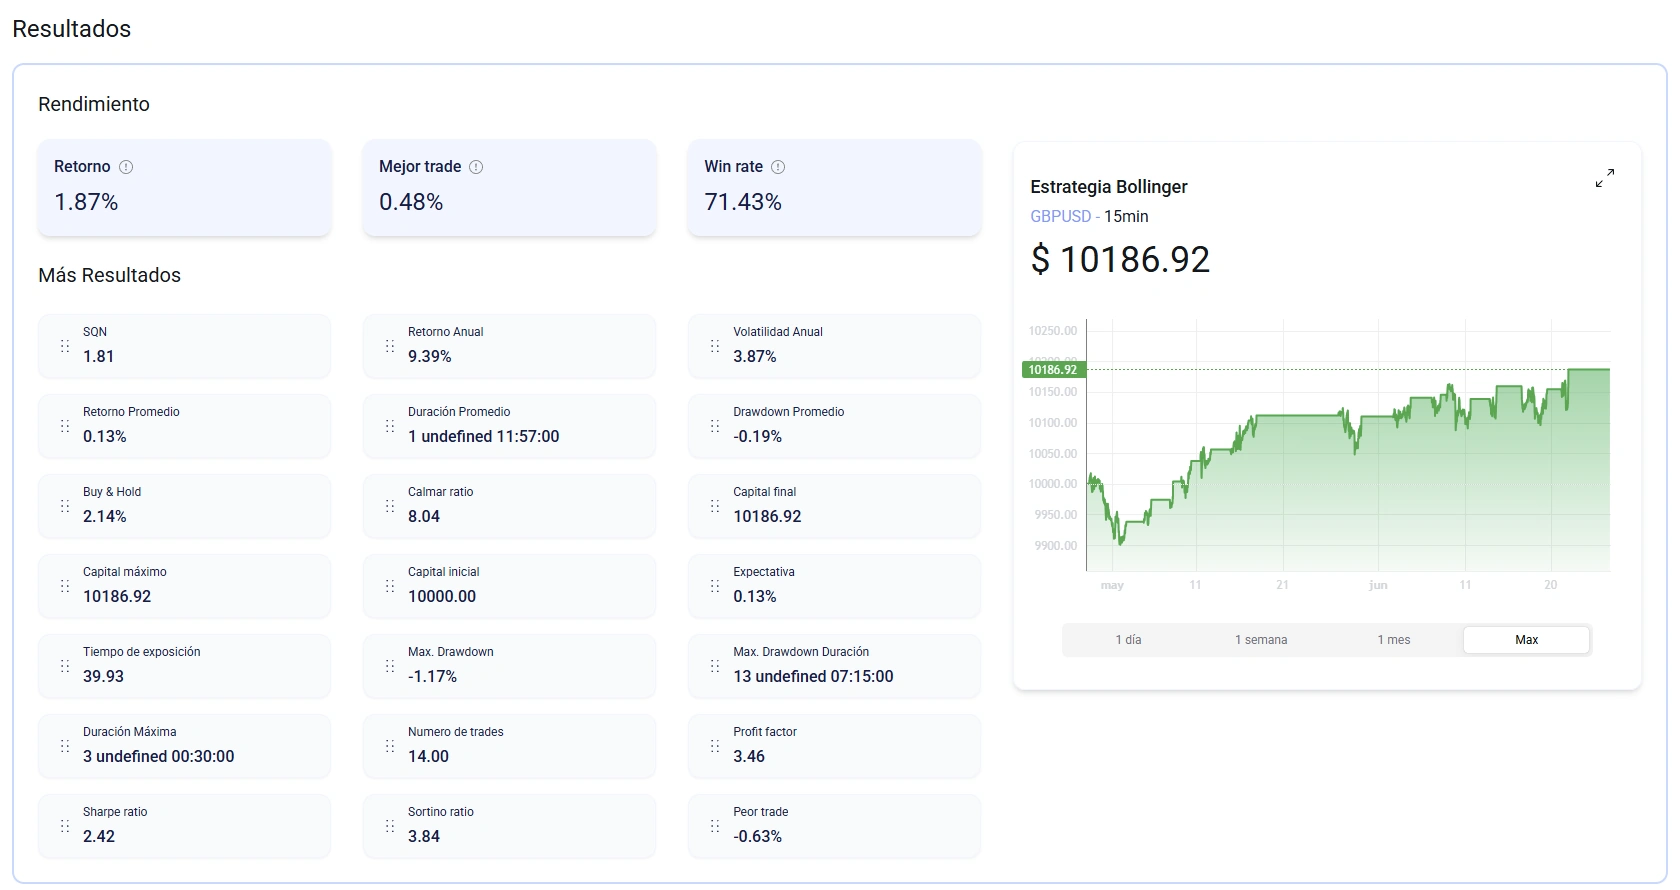
Results
The results we obtained for GBPUSD on a 15-minute timeframe are as follows:
Conclusions
We’ve now seen that Bollinger Bands are not just lines on a chart, but can serve as a high-precision radar to detect volatility, reversals, and price breakouts, even before they occur.
We’ve also learned that they can adapt to the market on their own, and with a good companion (like the RSI or MACD), we’ll understand the market much better. This is why many traders choose this indicator as part of their arsenal to combat the market and emerge victorious.
So now you know: stop reading, add them to your strategy, and observe them in action. Remember to combine them with other indicators, test them on different timeframes, and adapt them to your system.
A trader who truly understands Bollinger Bands not only knows what the price is doing at any given moment but also what it’s about to do.
No Comments