If you enjoyed our article on the SMA (Simple Moving Average) and are already using it, then you’ll find the EMA (Exponential Moving Average) even more useful.
The EMA is an enhanced version of the SMA, designed to react more quickly to price movements. This makes it an ideal tool for traders looking to identify trends faster and reduce signal lag, with a easy indicator.
Excited to learn more, aren’t you? I won’t keep you in suspense. Let’s get straight into understanding everything about this new average, and I’m confident that by the end of this article, you’ll be ready to start trading with it.
Contenido
History of the EMA
Similar to the SMA, the mathematical development of the exponential moving average originates more from the fields of statistics and signal processing than from pure technical analysis. As such, there isn’t a specific inventor or individual credited with its initial use.
As we discussed in the post about the SMA indicator, moving averages have been used in technical analysis for decades – even before the advent of computers. However, the EMA was developed to address a key limitation of the SMA: its lag.
Unlike the SMA, which assigns equal weight to all past prices, the EMA places greater emphasis on recent data. This allows the EMA to adjust more quickly to price changes, enabling traders to identify trends with less delay.
Confírmame si este tono y nivel de tecnicismo te parecen adecuados antes de que traduzca la siguiente sección.
Calculation of the EMA
Although the mathematical formula for the exponential moving average is more complex than that of the SMA, don’t worry: all trading platforms calculate it automatically!
Even so, it’s quite straightforward, and the steps to perform the calculation are just three:
- An initial SMA is calculated (for the first EMA value).
- A smoothing factor is applied, which is obtained with the following formula:

Where N is the number of periods chosen (for example, 10, 20, 50…).
And subsequently, the EMA is calculated with the following formula:

This means that the EMA responds more quickly to recent prices and filters out market noise more effectively.
Reading the EMA Indicator
How to interpret the EMA
- If the price is above the EMA, the trend is bullish.
- If the price is below the EMA, the trend is bearish.
- If the EMA is flat, the market is ranging (sideways).
Types of EMA based on the period
Just as with the SMA, depending on the period used, it will capture different market conditions:
- Short-term EMA (5 – 20 periods): Used to capture rapid trend changes.
- Medium-term EMA (50 periods): Identifies intermediate trends, ideal for swing trading.
- Long-term EMA (100 – 200 periods): Used to confirm long-term trends.
It’s important to note that the shorter the period, the faster the EMA reacts, but it will also generate more false signals.
Signals for Trading with the EMA
EMAs generate trading signals when the price interacts with them.
Price Crossing the EMA
- Buy when the price crosses above a key EMA (example: EMA 50).
- Sell when the price crosses below a key EMA.
Example: If the price was below the 50-period exponential moving average and now crosses above it, this can be a buy signal.
Moving Average Crossovers (Golden Cross & Death Cross)
Just like with the SMA, EMA crossovers are very powerful signals:
- Golden Cross: Occurs when a short-term EMA (50) crosses above a long-term EMA (200). Indicates a strong bullish trend.
- Death Cross: Occurs when a short-term EMA (50) crosses below a long-term EMA (200). Indicates a strong bearish trend.
Example: If the 50-period EMA crosses above the 200-period EMA, it’s a buy signal.
.
The EMA as Dynamic Support or Resistance
- In uptrends, the EMA acts as support.
- In downtrends, the EMA acts as resistance.
Example: If the price drops and touches the 50-period EMA, but then bounces upward, we might have a buying opportunity.
Combining with Other Indicators
The exponential moving average becomes even more powerful when used with other indicators:
EMA + RSI
- Buy signal: If the price is above the 50-period EMA and the RSI is in oversold territory (<30).
- Sell signal: If the price is below the 50-period EMA and the RSI is in overbought territory (>70).
EMA + MACD
The MACD uses EMAs in its calculation, so combining them increases precision:
- Buy if the MACD crosses upward and the price is above the 50-period EMA.
- Sell if the MACD crosses downward and the price is below the 50-period EMA.
EMA + Bollinger Bands
- If the price touches the lower band and is near the 200-period EMA, it may signal a bullish bounce.
- If the price touches the upper band and is near the 200-period EMA, it may signal a bearish move.
Simple EMA Strategy in BlueCandle
Let’s see how we can implement the “golden cross” in BlueCandle.
Required Indicators:
- 50-period EMA
- 200-period EMA
Entry Rules:
A buy order will be placed when:
- The 50-period EMA crosses above the 200-period EMA (Golden Cross).
- The price remains above both EMAs.
Exit Rules:
The trade will be closed when:
- The 50-period EMA crosses below the 200-period EMA (Death Cross).
- The price remains below both EMAs.
Backtest
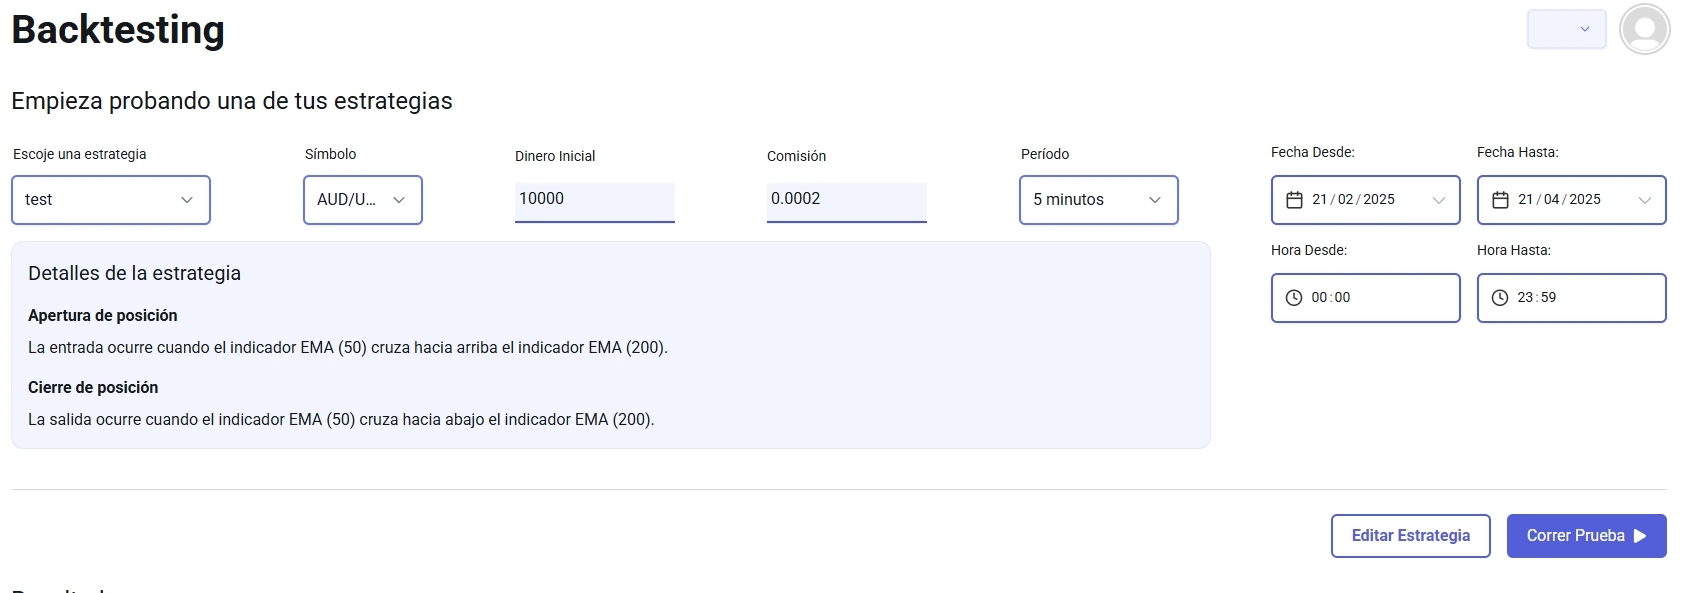
Let’s configure the backtest to trade on the Euro/Dollar pair so we can see the results.
Results
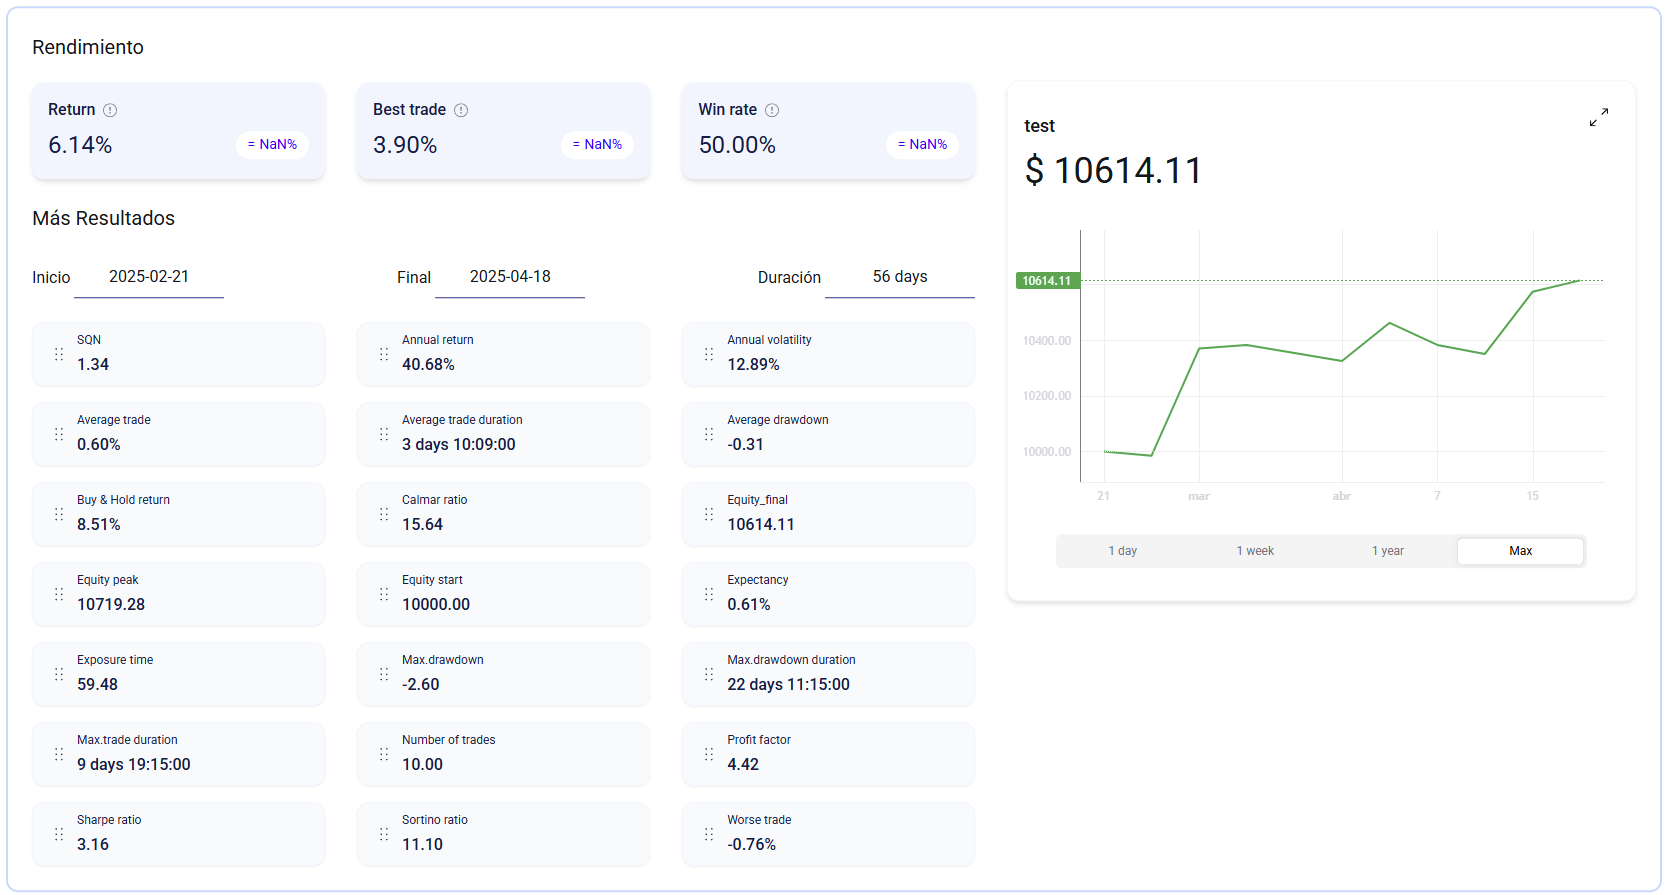
The results of this trade are quite good, as we can see in the results image:
Why does it work?
This strategy follows trends instead of trying to anticipate them, allowing you to capture the strongest moves and avoid trading in sideways markets.
Conclusion
As we’ve seen, the exponential moving average is an essential indicator for any trader. Its ability to react faster than the SMA and act as support or resistance makes it a powerful tool.
If you’re not using it yet, add it to your trading setup and start experimenting. It’s sure to make a difference in your trading.


