

if you’ve ever felt that traditional moving averages are too slow in strong trends or too fast in sideways markets, then you need to know the KAMA indicator (Kaufman’s Adaptive Moving Average).
Unlike the SMA or EMA,, which use a fixed period to calculate the average, the KAMA automatically adjusts its response speed based on market volatility. This makes it an incredibly useful tool for identifying trends without market noise generating false signals.
While many moving averages simply smooth the price in a constant manner, the KAMA changes its sensitivity depending on market conditions, avoiding false entries in sideways markets and allowing you to better capture real trends.
But let’s not dwell any longer and get straight to it. Let’s start with a bit of history.
Contenido
History
The KAMA indicator was developed by Perry Kaufman,a renowned trader and technical analyst, and he first published it in his book “Smarter Trading” in 1995. Kaufman always stood out for seeking adaptive indicators that better reflected the changing conditions of the market, and that’s how the KAMA was born.

Kaufman designed this moving average to solve a common problem: traditional moving averages work well in trends but generate many false signals in sideways markets.
The KAMA solves this problem by automatically adjusting its smoothing:
- If the market is trending, it becomes faster.
- If the market is ranging, it becomes slower to avoid false signals.
That’s why the KAMA is considered a smart moving average, capable of adapting to market conditions.
Calculation
Although the calculation of the KAMA indicator might seem complex, don’t worry, because all modern platforms (especially BlueCandle) do the heavy lifting for you. However, understanding how it works can give you advantages when using it.
Key steps in its calculation:
The KAMA has three essential components in its calculation:
- Price Change: The price change over a specific period is compared to the total volatility in that same period.
- Volatility: The absolute movement between consecutive periods is summed over “n” periods.
- Adaptive Smoothing Constant: This depends on the ratio between the price change and the volatility, adjusting automatically.
In this way, when the market moves quickly and with a trend, the KAMA gets closer to the current price. When the market is sideways, the KAMA smooths out to avoid false signals.
Let’s see how it looks on a chart:
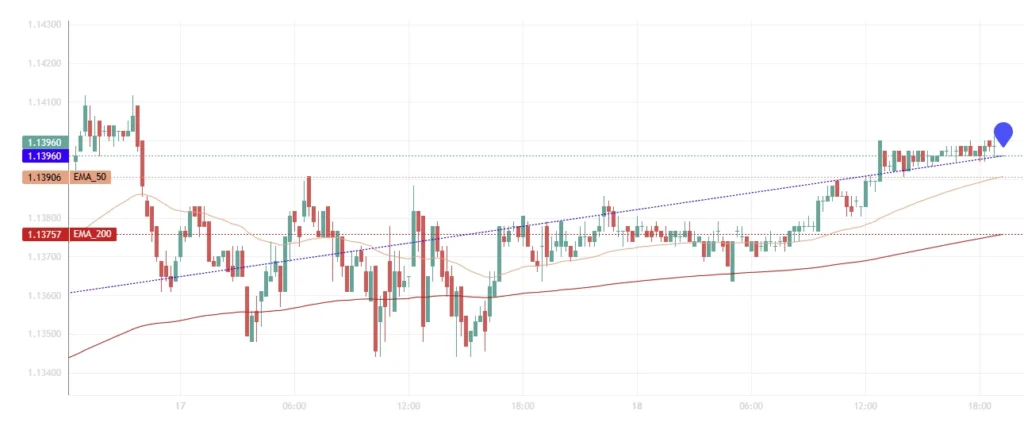
Reading the KAMA Indicator
How to interpret the KAMA:
- If the price is above the KAMA, the trend is bullish.
- When the price is below the KAMA, the trend is bearish.
- If the KAMA is flat, the market is ranging, and it’s best to avoid trading trends.
But now you might be thinking: “This is all well and good, but what advantages does it have over other moving averages?” Very good question. Well, the advantages are as follows:
- Less Noise: Reduces false signals in sideways markets.
- Faster in Trends: Adjusts when the market moves strongly.
- More Reliable: Works well in all markets and timeframes.
Signals for Trading with KAMA
The KAMA generates signals when it interacts with the price and other indicators.
Signals for Trading with KAMA
The KAMA generates signals when it interacts with the price and other indicators.
Price Crossover with KAMA
- Buy: when the price crosses above the KAMA.
- Sell: when the price crosses below the KAMA.
- Example: If the price was below the KAMA indicator and now crosses above it, it’s a buy signal.
KAMA Slope Change
- If the KAMA changes to an upward slope, it confirms a bullish trend.
- If the KAMA changes to a downward slope, it confirms a bearish trend.
- Example: If the KAMA was flat and starts to rise, it could be a sign that the market is starting a bullish trend.
Using KAMA as Dynamic Support and Resistance
- In bullish trends, the KAMA acts as support.
- In bearish trends, the KAMA acts as resistance.
- Example: If the price falls and touches the KAMA in an uptrend, it could be a buying opportunity.
Combination with Other Indicators
- KAMA + RSI
- Buy signal: If the price is above the KAMA and the RSI is in oversold territory (<30).
- Sell signal: If the price is below the KAMA and the RSI is in overbought territory (>70).
- KAMA + MACD
- The MACD measures trend strength and is ideal for confirming KAMA signals:
- Buy: if the MACD crosses above the signal line and the price is above the KAMA.
- Sell: if the MACD crosses below the signal line and the price is below the KAMA.
- KAMA + Bollinger Bands
- If the price touches the lower Bollinger Band and is near the KAMA, it could be a bullish rebound.
- If the price touches the upper Bollinger Band and is near the KAMA, it could be a bearish signal.
Simple Strategy with KAMA
In this section, we will look at an adaptive trend strategy with KAMA and RSI.
Required Indicators
- KAMA (10 periods)
- RSI (14 periods)
Entry Rules
Buy when:
- The price crosses above the KAMA.
- The RSI is above 50 (confirmation of bullish momentum).

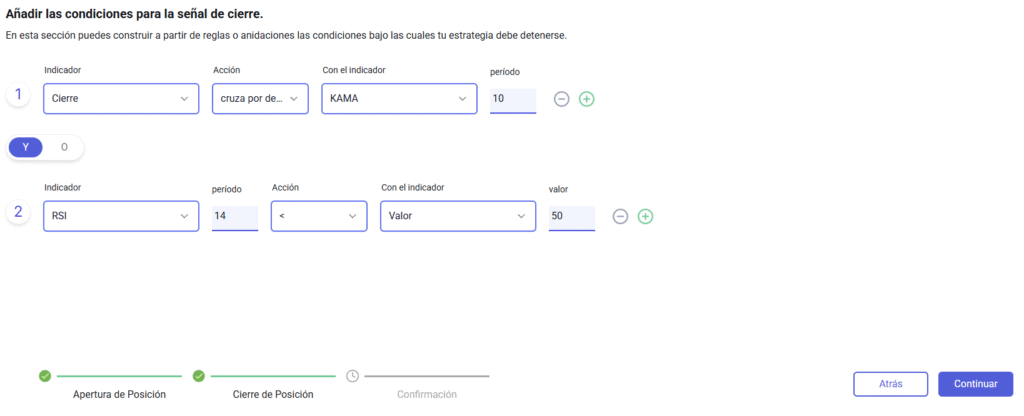
Exit Rules
Sell when:
- The price crosses below the KAMA.
- The RSI is below 50 (confirmation of bearish momentum).
Backtesting
Let’s do the backtesting with some simple parameters.

Resultados
Now let’s look at the results:
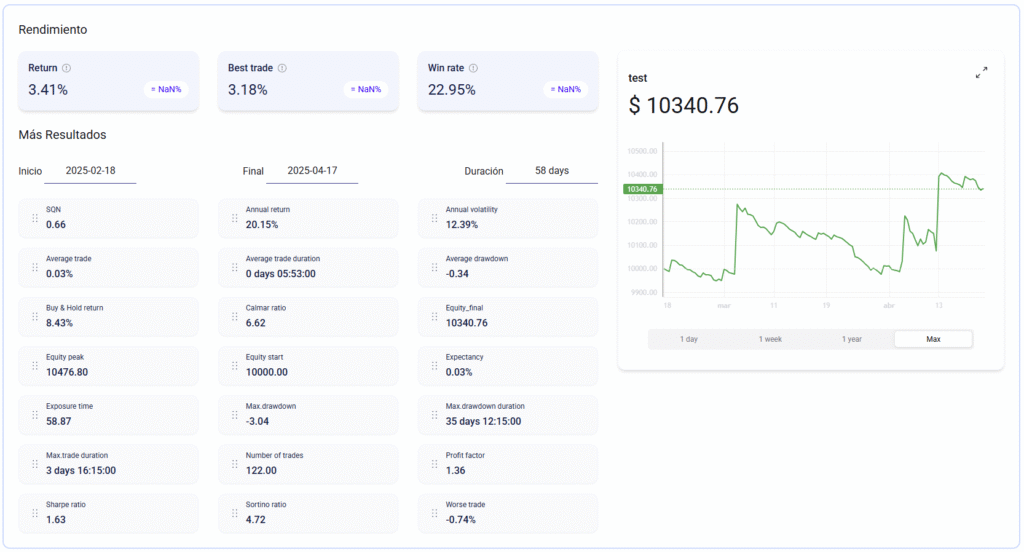
Why Does It Work?
Esta estrategia funciona bastante bien porque se adapta a las condiciones del mercado, y de esta forma evita señales falsas en rangos.
Conclusion
The KAMA indicator is a smart moving average, designed to adapt to market changes and filter out noise. It’s ideal for traders looking for precision and wanting to avoid false signals in sideways markets.
If you haven’t tried it yet, add it to your platform and experiment with it. It could improve your trading!
Would you like to apply this strategy without programming?