If there’s one indicator that can’t be missing from a trader’s toolkit, it’s the RSI (Relative Strength Index). This powerful oscillator not only tells you if an asset is overbought or oversold, but it also helps you spot trend changes before they happen (which is extremely important in the world of trading).
Would you like to know when an asset is too expensive and might fall, or when it’s very cheap and ready to rise? The RSI does precisely that, indicating key overbought and oversold levels, and revealing potential trend changes.
But as always, let’s get straight to what really matters without further ado.
History
The RSI was created in 1978 by J. Welles Wilder, a mechanical engineer turned trader, who also developed other indicators such as the ADX and the Parabolic SAR.

Wilder designed the RSI as a way to measure the strength and speed of price movements, helping traders spot potential reversals before they are evident on the chart.
Since then, the RSI has become one of the most popular indicators in the trading world and continues to be used by professional and retail traders worldwide.
Calculation
Although current platforms automatically calculate the RSI, understanding how it’s generated can enhance your trading.
The only part that might be a little complex is where it calculates the EMA, which is the exponential average of the last “n” periods, and where “up” signifies the “n” periods that went up and “down” the “n” periods that went down. For everything else, it’s a very simple formula.
The very simple RSI formula:

By default, n is usually n=14, where we examine the last 14 periods of the candlestick chart, or put more simply: the last 14 candles.
Can we change this number? Absolutely, Wilder mentioned when he created the RSI that 14 seemed to be the value that calculated the RSI best. But you are very free to change this value and adapt it to your trading.
The result of this formula is always between 0 and 100, where values close to zero signify that the price is undervalued, and values close to 100 signify that the price is overvalued.
Reading the RSI Indicator
As we’ve seen, the RSI is mainly used to identify overbought and oversold levels, and since saying “close to 100” or “close to zero” is very subjective, these values are normally used:
Text in English:
- RSI above 70: Overbought asset (possible fall).
- RSI below 30: Oversold asset (possible rise).
- RSI between 30 and 70: Market in equilibrium (no clear signals).

RSI Indicator
If we want to be a little more precise, we can still adjust these values a bit further (although, as with the period, we can play with the value), and do it like this:
- RSI above 80: Extremely overbought (higher probability of correction).
- RSI below 20: Extremely oversold (possible strong rebound).
A fairly common mistake is thinking that an overbought asset will fall immediately or that an oversold asset will rise right away. This doesn’t always have to be the case; the RSI is a warning sign, not an immediate entry signal.
Signals for Trading with the RSI
The RSI generates several signals for trading:
Signal #1: Overbought and Oversold
- Buy: when the RSI falls below 30 and then rises above it.
- Sell: when the RSI rises above 70 and then falls below it.
Example: If a stock has an RSI of 25 and then crosses above the value of 30, it could indicate a potential upward rebound.
Signal #2: RSI-Price Divergences
Divergences occur when the RSI and the price move in opposite directions.
- Bullish Divergence: The price makes a new low, but the RSI makes a higher low. This indicates that bearish pressure is losing strength, and a bullish reversal may be coming.
- Bearish Divergence: The price makes a new high, but the RSI makes a lower high. This suggests that the bullish trend is weakening, and a fall may be coming.
Example: If a stock price rises to $100, but the RSI marks a lower value than at its previous high, it’s a warning sign of a potential fall.
Signal #3: 50 Level Crossover
Another interpretation that is widely used is the following:
- If the RSI crosses above 50, the trend may turn bullish.
- If the RSI crosses below 50, the trend may turn bearish.
This signal is not one of the most powerful, but it’s good to keep in mind.
Combination with Other Indicators
The RSI becomes even more powerful when used with other indicators.
RSI + Moving Averages
- If the RSI rises above 50 and the price is above the 50-period EMA, it’s a buy signal.
- If the RSI falls below 50 and the price is below the 50-period EMA, it’s a sell signal.
RSI + ADX
- If the RSI indicates oversold conditions, but the ADX is low (<20), it’s better to wait, as there isn’t a strong trend.
- If the RSI indicates overbought conditions, but the ADX is high (>40), the bullish trend might continue.
RSI + ADX
- Si el RSI indica sobreventa, pero el ADX está bajo (<20), es mejor esperar, ya que no hay una tendencia fuerte.
- Si el RSI indica sobrecompra, pero el ADX está alto (>40), la tendencia alcista podría continuar.
Simple RSI Strategy on BlueCandle
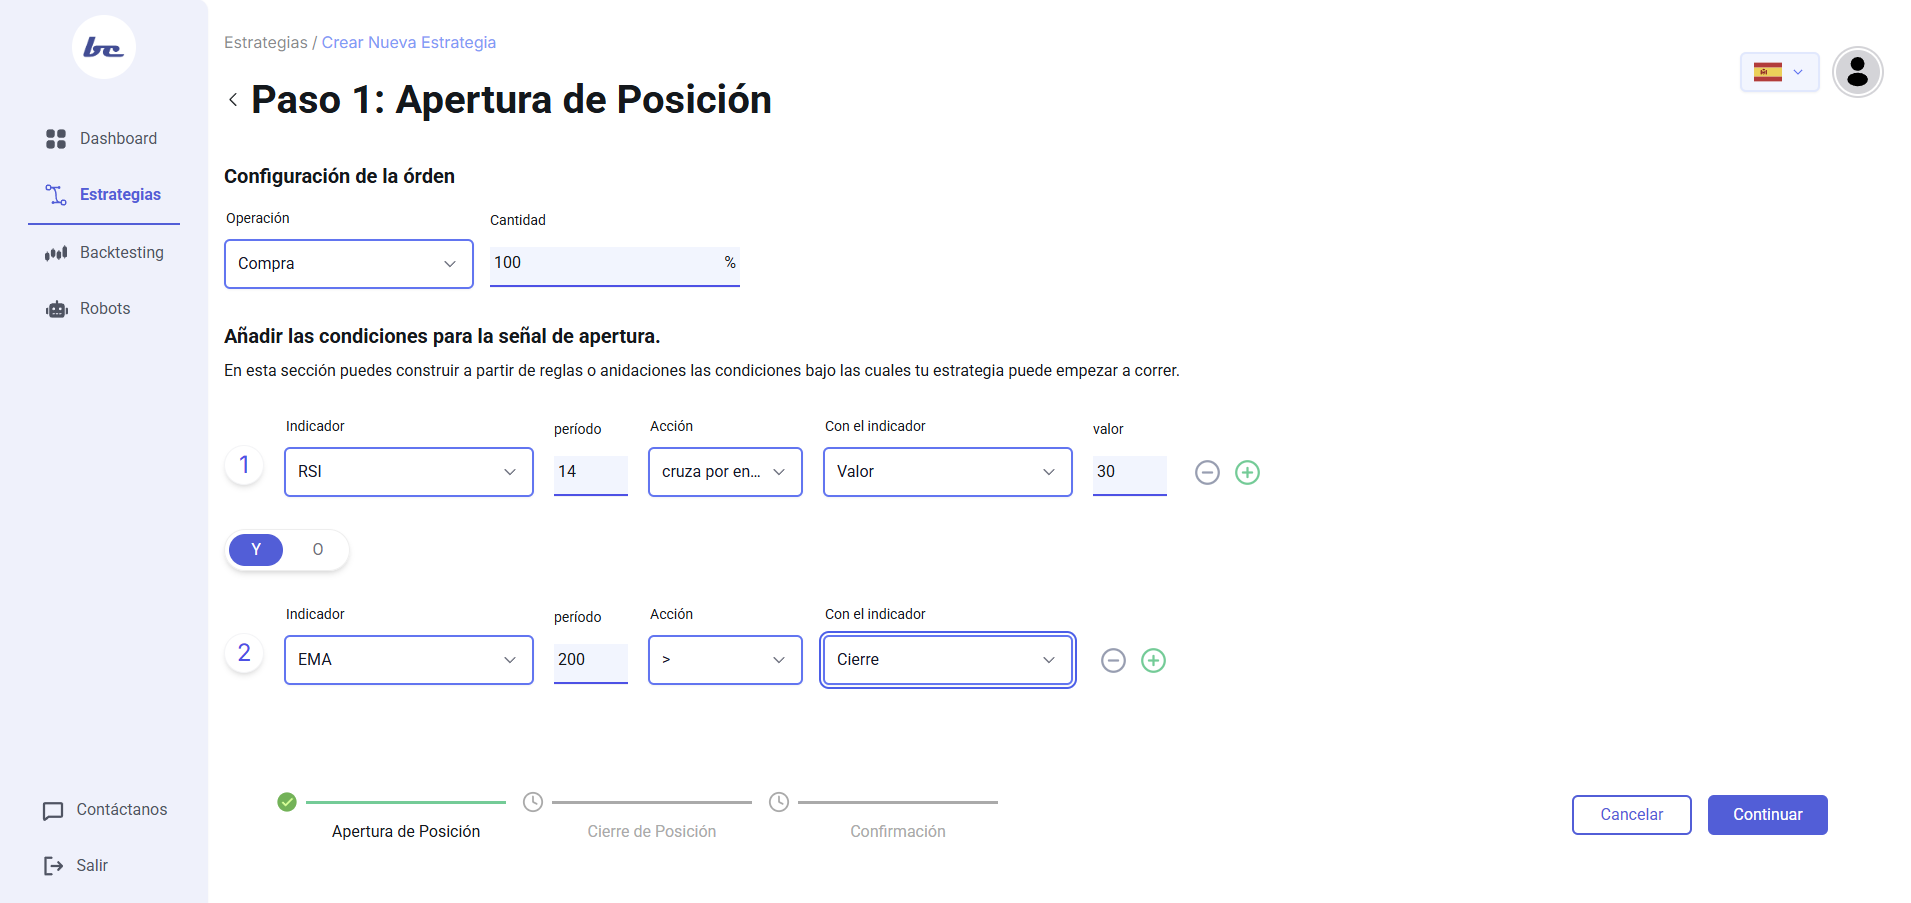
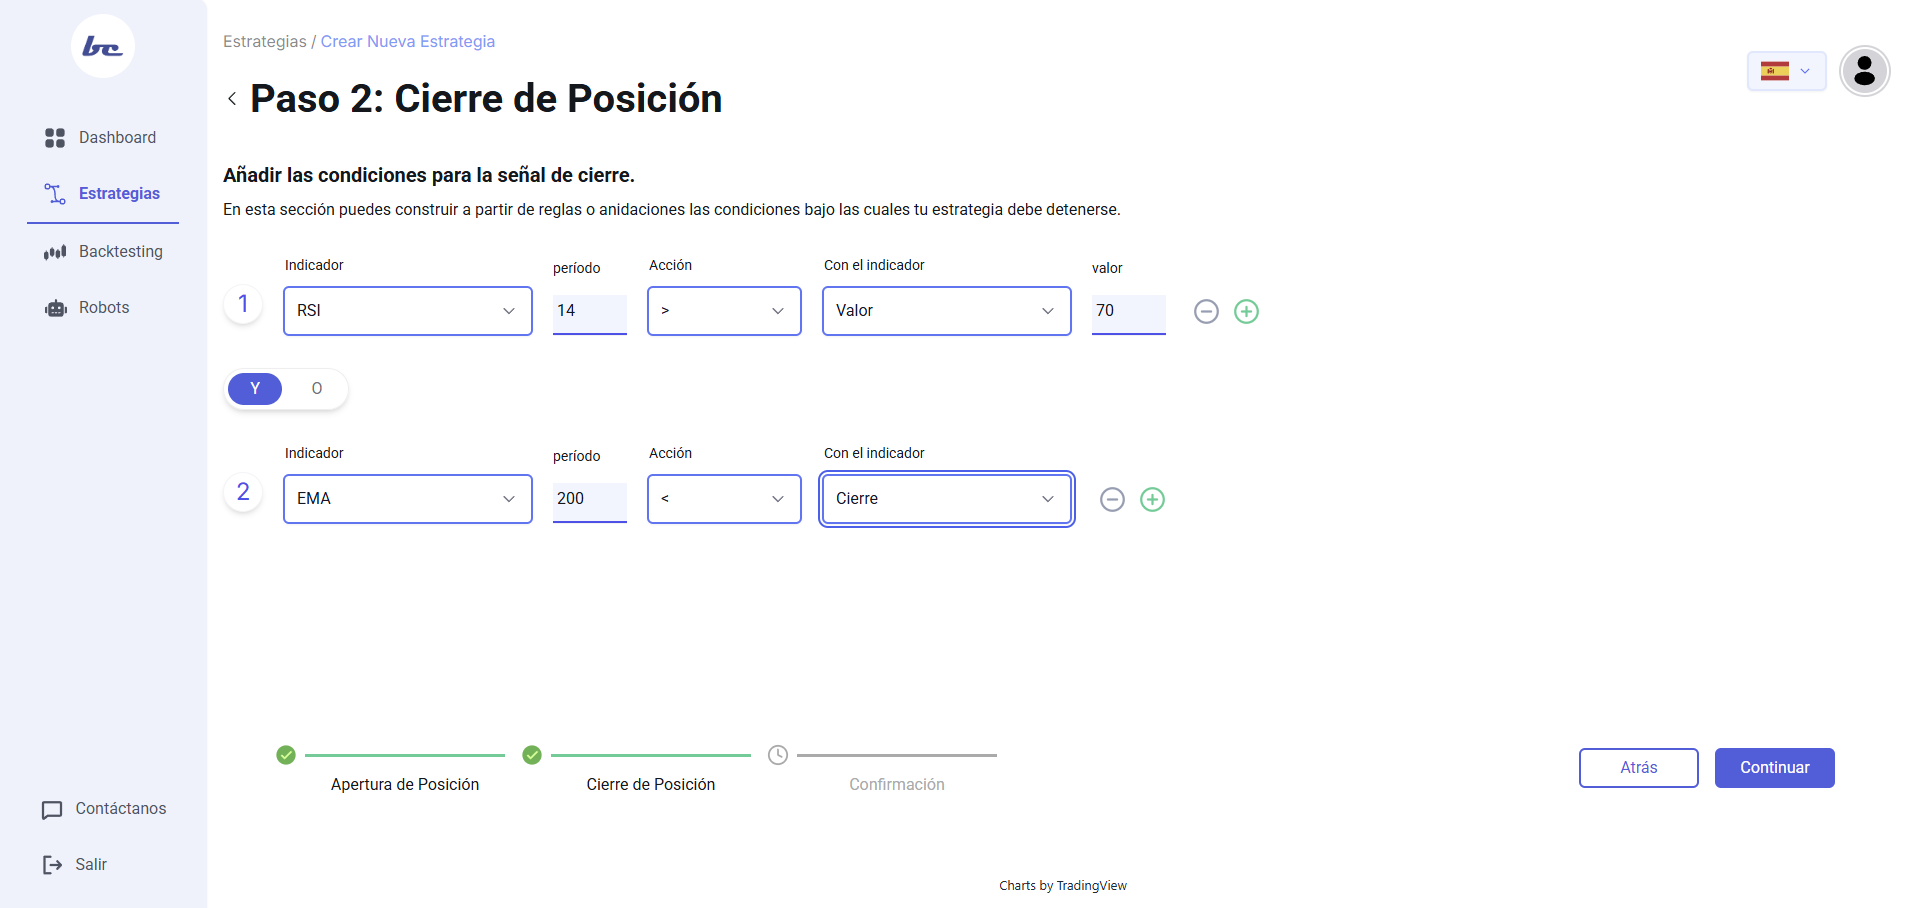
Let’s see how we can use the RSI together with a moving average to create a winning trading strategy and how we can set it up on BlueCandle to see the results.
Required Indicators
The indicators we are going to use for this strategy are the following:
- RSI (14 periods)
- Exponential Moving Average (EMA 200)
Entry Rules
This strategy will enter in the following case:
- RSI falls below 30 and then rises above it.
- The price is above the 200-period EMA (confirming an upward trend).

Exit Rule:
- RSI is above 70 and then falls below it.
- The price is below the 200-period EMA (confirming a downward trend).

Why Does It Work?
This strategy avoids buying into false oversold conditions within downtrends and only trades in the direction of the dominant trend.
Conclusion
As you can see, the RSI is one of the most versatile and easy-to-use indicators. Whether it’s for identifying overbought and oversold conditions, spotting divergences, or confirming trends, this indicator can make a significant difference in your trading.
If you haven’t tried it yet, you can do so on BlueCandle and start experimenting. You might find new trading opportunities you didn’t see before!
Try it out and let us know how it goes!


