This might be one of the first questions that comes to mind when we start trading and see those lines crossing on the charts: Technical analysis works? Myths? In this article, we hope to shed some light on the subject and show you that it’s not all magic.
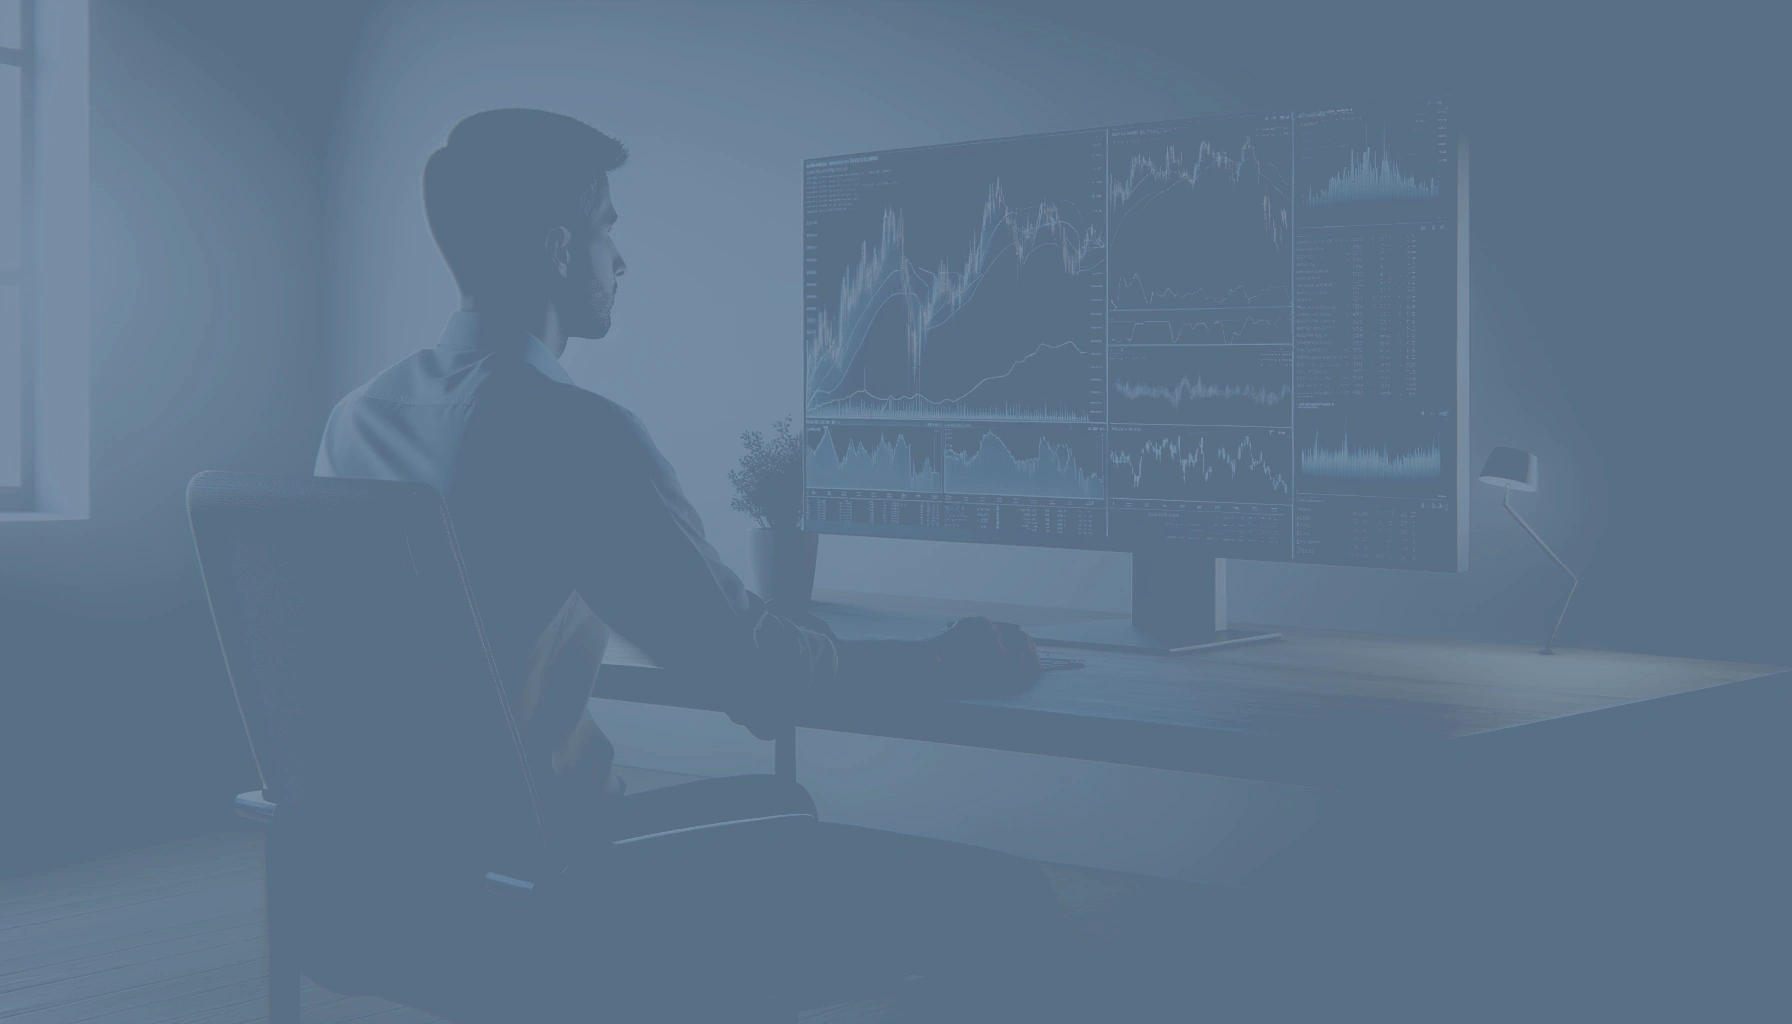
Technical analysis is one of the oldest and most popular methods for making trading decisions. Millions of traders and investors use it daily to analyze prices, identify trends, and execute trades. However, it is also one of the most criticized approaches.
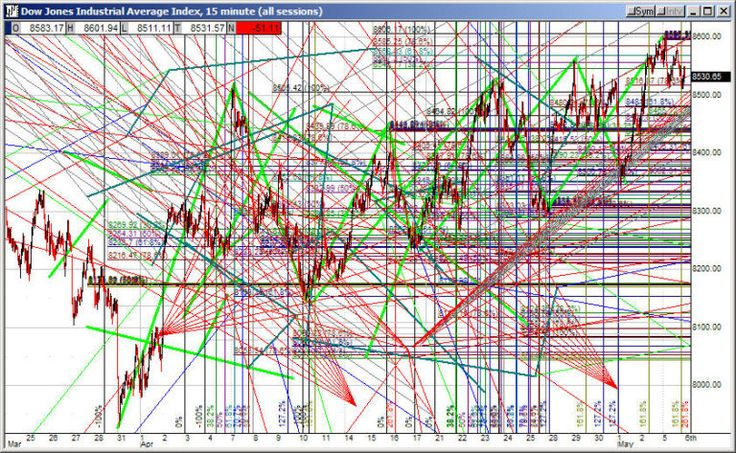
For many, technical analysis is nothing more than “drawing lines on a chart,” a kind of financial astrology without any scientific basis. Many traders even claim that only fundamental analysis can explain price movements, relegating charts to an anecdotal role.
But… what if I told you that this view is incomplete?
Additionally, understanding the question Does Technical Analysis Work in Trading? Myths can help clarify many misconceptions surrounding this method.
The reality is that technical analysis doesn’t claim to be a crystal ball (and I believe it never has). It doesn’t seek to predict the future with exact precision but rather to interpret patterns of human behavior, identify probabilities, and, above all, manage risk intelligently.
Far from being mere superstition, its effectiveness relies on:
- Proven statistical principles,
- Laws of supply and demand,
- And the collective psychology of market participants.
In fact, there are many academic studies, economic theories, and behavioral finance research that have shown prices tend to reflect market information. Patterns repeat, and human behavior is predictable under certain circumstances.
In this article, I will explain it to you with solid arguments, far from myths and sensationalism. We will see:
- The economic logic behind the charts
- The psychology that moves prices
- The statistical evidence that supports its use.
Get ready to discover the truth behind technical analysis and understand why it remains an essential tool in the arsenal of any serious trader.
Contenido
- 1 Prices Already Reflect All Information (Weak Efficient Market Hypothesis)
- 2 Patterns Repeat Because Human Psychology Doesn’t Change
- 3 The Self-Fulfilling Prophecy: Technical Analysis Works Because Everyone Believes It Works
- 4 Risk Management: The True Power of Technical Analysis
- 5 Trends and Key Moments: The Essence of Dow Theory
- 6 From Technical Analysis to Algorithmic Trading: How to Take It to the Next Level
- 7 Conclusions
Prices Already Reflect All Information (Weak Efficient Market Hypothesis)
One of the conceptual pillars that justifies why technical analysis works is the Efficient Market Hypothesis (EMH), developed by economist Eugene Fama in 1970 in his publication “Efficient Capital Markets: A review of Theory and Empirical Work”.

The EMH holds that the prices of financial assets already reflect all available information in the market. That is, everything that is known (or can be known) about a stock, an index, or a cryptocurrency —news, corporate earnings, future expectations, macroeconomic data— is already discounted in the current price.
Fama defined three levels of efficiency:
Weak Form: All past information (prices, volumes) is already incorporated into the price. Semi-strong Form: In addition to past information, current public information is also included. Strong Form: All information, even private or confidential, would be reflected in the price.
Technical analysts rely on the “Weak Form” of the EMH to justify their charts. If all past information is already in the price, then studying the evolution of that price (lines, patterns, indicators) is a perfectly valid tool to understand market behavior.
For this reason, a technical analyst does not need to look at companies’ balance sheets, news, or business models. Instead, since all of that is reflected in the price, they only need to look at the price to know how it will move in the future.
This doesn’t mean that technical analysis is infallible (far from it), but rather that it is a perfectly valid way to read market psychology, which is reflected in asset prices.
Patterns Repeat Because Human Psychology Doesn’t Change
If there’s one profound reason why technical analysis works, it’s this: human nature is cyclical; it doesn’t evolve as quickly as we think.
Mathematical logic isn’t the only thing used in trading; it’s heavily influenced by emotions: fear of losing money, greed for gaining more, euphoria from rallies, and panic during crashes, etc. All these emotions are reflected in charts, forming recurring patterns that technical analysts study and exploit.
So, as you can probably imagine, prices are a visible mark of human behavior. Every candle, every market oscillation, is the sum of millions of people reacting similarly to the same signals.
From all these studies on human behavior, the famous chart patterns emerge:
- Triangles – Due to indecision.
- Bottoms or Tops – Due to psychological trend levels.
- Head and Shoulders – Changes in trend due to loss of confidence.
These patterns aren’t coincidences; they’ve been widely documented by authors like John J. Murphy in his classic “Technical Analysis of the Financial Markets” and Kirkpatrick & Dahlquist in “Technical Analysis: The Complete Resource for Financial Market Technicians.“

In both books, it’s demonstrated with historical examples (in stocks, currencies, commodities, forex, and even cryptocurrencies) that these patterns appear again and again. And you might be asking yourselves: “Okay, I get that they repeat, but why?”
Well, the answer is that human emotions don’t change. We keep making the same mistakes, and investor psychology remains the same as it was 50 or 100 years ago. So simple, yet so complex. Even with the arrival of algorithmic trading, social media, and artificial intelligence, emotional cycles persist.
So, we can say that technical analysts don’t try to predict the future as if looking into a crystal ball. Instead, they try to detect human behavior in the past to see what the most probable reaction might be in the future. In this case, it’s a bit about the probabilities that the behavior will remain the same.
The Self-Fulfilling Prophecy: Technical Analysis Works Because Everyone Believes It Works
One of the most interesting arguments for why technical analysis works is very simple: It works because millions of traders use it, which is to say, it’s a self-fulfilling prophecy. In short, it works because everyone believes it works. A bit crazy, right?
The concept comes from sociology: “If enough people believe in something, their actions can turn that belief into reality.” And in financial markets, it’s clear something similar happens. For example: If thousands of traders see a support level and act similarly (buying at that level), then logically the price will bounce at that point.
This same pattern occurs with everything: resistances, moving averages, indicators, chart patterns, etc. The simple fact that many traders operate with the same knowledge leads to predictable collective reactions. All of this is now reinforced by technical indicators, real-time platforms, and the books and courses that teach the same patterns.
Economist Andrew W. Lo, along with Mamaysky and Wang (2000), published the study “Foundations of Technical Analysis: Computational Algorithms, Statistical Inference, and Empirical Implementation“ in the Journal of Finance. In its pages, patterns were analyzed using algorithms, which demonstrated that some of them do have predictive value in certain contexts. They emphasize that part of this predictability is due to the self-fulfilling prophecy effect.

Furthermore, Daniel Kahneman (Nobel laureate and author of famous books such as “Thinking, Fast and Slow”) in “Prospect Theory: An Analysis of Decision under Risk,” and Richard Thaler, in “Misbehaving: The Making of Behavioral Economics,” have shown through behavioral finance how traders are not 100% rational. They have biasesand make mistakes like anyone else, and most importantly, that collective reactions generate inefficiencies that can be exploited through technical analysis.
Risk Management: The True Power of Technical Analysis
It’s important to remember that beyond predicting prices, technical analysis is a risk control tool. It allows for establishing entry, stop-loss, and take-profit levels with clear criteria.
In the markets, it’s not always about guessing where the price will go, but about knowing how much you stand to lose when you’re wrong and how much you stand to gain when you’re right. This is where technical analysis works and becomes a very important tool, as it allows you to establish clear entry and exit levels based on market structure (supports, resistances, trends, etc.).
With good technical analysis, a trader can:
- Identify key zones where the probability plays in their favor.
- Determine an exit point (Stop-loss) for when things go wrong.
- Set a realistic profit-taking target (take-profit) based on the context.
In other words, one of the fundamental reasons why technical analysis works is because a trader can control losses and establish strategies where the risk/reward ratio is always favorable.

One of the most important authors in this field is Van K. Tharp, and in his book “Trade Your Way to Financial Freedom,” he states the following:
“You don’t need to predict correctly 70% of the time to make money. You need to manage risk correctly on every trade.”
Tharp makes it clear: it’s not necessary to guess the market’s direction, but rather to:
- Have a clear plan based on probabilities.
- Limit losses when you’re wrong.
- Maximize profits when you’re right.
In the long run, this risk management is what separates profitable traders from those who lose capital.
Trends and Key Moments: The Essence of Dow Theory
Long before computers existed (in the 19th century), Charles H. Dow identified the principles of technical analysis. His “Dow Theory” remains the foundation upon which all modern technical analysis has been built.
Dow observó que los mercados financieros tienden a moverse en tendencias, y estas tendencias reflejan el comportamiento colectivo de los inversores. Con esta información creo una serie de principios para explicar los precios, los más importantes son:
- The market discounts everything (anticipating news and data).
- Prices move in trends (up, down, or sideways).
- A trend remains in effect until it gives clear signs of change.
- Volumes confirm trends (higher volume, greater reliability).
- Indexes must confirm each other (correlation between sectors).
Because of all this, one of the most famous phrases in trading, “the trend is your friend,” comes from this theory.
You might think that since the 19th century, markets have changed a lot and this is no longer valid, but you would be terribly wrong: the nature of markets, as we’ve discussed before, has not changed.
That’s why trend lines, support, resistance, and breakouts remain effective. They allow you to identify key moments where the probability of success is higher.
More than 100 years later, Dow Theory remains the cornerstone upon which technical analysis is based due to its simplicity.
From Technical Analysis to Algorithmic Trading: How to Take It to the Next Level
Everything we’ve seen about patterns, trends, and risk management is perfectly applicable to both traditional manual trading and algorithmic trading. But in this case, the great advantage of algorithms is that they give us some other benefits. For example:
- Systematically apply technical analysis rules.
- Eliminate emotions from decision-making.
- Trade with discipline 24 hours a day without fatigue or impulses.
Normally, this field is reserved for programmers, and programming a trading robot is a complex task. With BlueCandle, you can start for free, both by testing strategies with different indicators (like the SMA or the KAMA, which we’ve already covered) and seeing the results, as well as putting strategies into operation with a robot.
Our platform allows traders of all levels to:
- Create and test technical strategies without needing to program.
- Automate trading with optimized algorithmic robots.
- Control risk with clear parameters, like large funds do.
Because the key isn’t to predict the future, but to manage uncertainty with intelligence and efficiency.
Conclusions
As we’ve seen, technical analysis is not infallible, but it is a powerful statistical and psychological tool. It’s not about guessing the future, but about managing uncertainty with discipline and probability.
In summary, we can say that technical analysis is the following:
- A tool that reflects the psychology of traders in the market through visual patterns.
- It allows you to detect trends and key moments to minimize losses.
- And it facilitates risk management.
The key is not to always be right, but to know when to act, when not to, and how much to risk on each trade.
And as John J. Murphy says:
“Technical analysis is simply the graphical visualization of the law of supply and demand.”
This struggle remains relevant after more than a century, and as long as the market continues to be driven by people (or by algorithms created by people), technical analysis will continue to work.
No Comments